Monitoring energy data with the Powerfox Exporter
- Published on
Introduction
Powerfox is the leading open energy management system for digital electricity, water and heat meters with almost 30,000 connected households in germany. The system consists of a module for reading the optical interface of the smart meter, the poweropti, and an app for Android and iOS. The poweropti transmits the energy data via your home WiFi and makes it available to the app. This enables real-time energy monitoring and a lot more innovative use-cases.
In addition to the app, Powerfox also offers a REST API. Various SmartHome platforms such as openHAB or ioBroker already use this interface. For my purposes, however, I would like to visualise the energy data in Grafana. This allows me to link consumption and feed-in data with photovoltaic generation (via OpenDTU) and to recognise PV surpluses, for example.
This gave rise to the idea of the powerfox exporter, which collects the energy data from the Powerfox platform and makes it available for prometheus.
Key Features
- Effortless integration: Easily incorporate power-related data into an existing monitoring infrastructure such as Grafana. Just check out the repository and run it as a standalone python script or use the provided docker image. The repository also includes an example configuration for docker-compose and prometheus.
- Customizable alerts: You can track power usage in real-time, allowing you to set up customisable alerts based on specific power thresholds using the alert manager or within Grafana.
- Historical data analysis: The use of long-term storage such as Mimir allows historical energy data to be archived. This data can be used to identify trends or to implement energy efficiency measures.
Getting Started
Assumption: The poweropti is installed and sending data to your smartphone app. Otherwise, please follow the instructions provided with the device.
Install the exporter
There are several ways to install and run the exporter. I will describe the method using docker compose. As docker images are automatically built for various architectures and pushed to Docker Hub, you can use the following docker-compose.yml:
version: '3.8'

services:
  powerfox-exporter:
    image: martinlowinski/powerfox-exporter:latest
    restart: always
    environment:
      - POWERFOX_API_USER=username
      - POWERFOX_API_PASSWORD=password
      - POWERFOX_DEVICE=123456789
Enter in your Powerfox credentials and device ID and run docker compose up. If you see “Metrics loop started.” in the logs the exporter is up and running. To change the default configuration, you can set POLLING_INTERVAL_SECONDS for the API polling interval or LOGLEVEL depending on your logging needs.
Configure Prometheus
To scrape the exported metrics, the prometheus configuration requires an additional job:
scrape_configs:
  - job_name: 'powerfox-exporter'
    scrape_interval: 60s
    static_configs:
      - targets: ['powerfox-exporter:9813']
Please make sure that prometheus can access the docker container of the powerfox exporter. If you need to run the exporter on a different port, you can set EXPORTER_PORT or change the mapping in the docker-compose.yml.
Grafana Dashboard
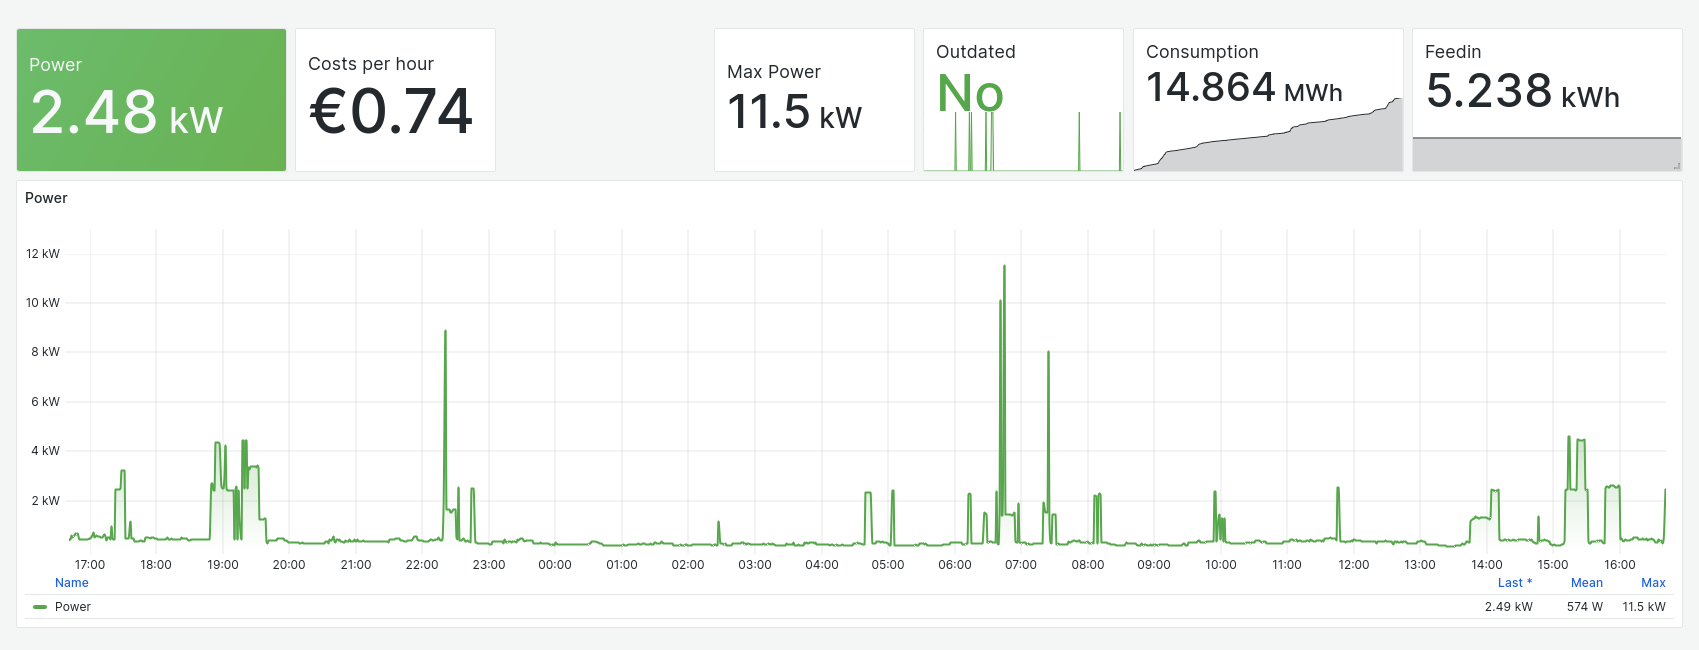
The exporter provides the following metrics:
powerfox_device_consumption: Device consumption reading in kWhpowerfox_device_feedin: Device feedin reading in kWhpowerfox_device_power: Device current power in Wpowerfox_device_outdated: Device data is currently outdated
I have created a sample grafana dashboard for this exporter, feel free to use it or build your own.
Contributing
The Powerfox Exporter is released as an open source project. Please feel free to contribute to the project, give feedback, and help improve the tool for the benefit of the whole community.